Showing posts with label uses. Show all posts

Wednesday, November 11, 2009

PowerPoint output for compelling presentations

Both bCisive desktop and bCisive Online have powerful facilities to take your maps and break them into sequences of PowerPoint slides. There is also a simple strategy to break a complex issue embodied by a big map into an easy-to-follow story.

Together, this facility and the systematic approach add up to compelling presentations.

Maps trump bullet points for visual impact
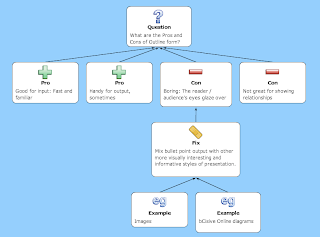
Compare the visual impact of bullet points, for example:
  • What are the Pros and Cons of Outline form?
    • Pro: Good for input: Fast and familiar
    • Pro: Handy for output, sometimes
    • Con: Boring: The reader / audience's eyes glaze over
      • Fix: Mix bullet point output with other more visually interesting and informative styles of presentation.
        • E.g.: Images
        • E.g. bCisive Online diagrams
    • Con: Not great for showing relationships
with the corresponding bCisive Online map:

Click for full size

Far more compelling, eh?

Problem: Big maps are intimidating
Big maps, often the outcome of fruitful group discussion, tend to be intimidating when presented to someone who wasn't there to see them emerge. We recommend that you break them into bite-sized chunks to form a story.

Solution: Tell a story
In this post on the bCisive Online blog Anna walks through an easy method to do this. The slide sequence drops out almost effortlessly ... once you know how!

Scientific writing

Geoff Hyde is putting together a free online course on scientific writing, using Rationale as the tool of choice. He's cautious, but it's already up, and we expect that he'll refine it over time.
When the course is fully developed, its design will allow it to be done independently online by anyone who wants to improve their science writing skills. Alternatively, it could be done in conjunction with a teacher who provides feedback on certain exercises. The great majority of the content, and exercises, however will not require teacher feedback. -- Geoff Hyde
Why Rationale?

I highly recommend however that you do the course by accessing the course web site within the argument mapping application Rationale.

I have been using Rationale for several years now in Scientific Writing courses that I run for postgraduate students at the National Centre for Biological Sciences, Bangalore. Rationale is mainly focussed on teaching people how to think clearly about contentious issues, and has very successfully popularized a diagrammatic method of argument development.

My experiences in the classroom have taught me that this diagrammatic approach is also a great starting point for writing all types of scientific text. It is the most practical way to outline that I have come across. Outlining is often promoted as a writing tool because it forces the writer to focus first on organising ideas, before moving onto packaging them. Getting your thoughts in order is very important - many writers waste a lot of time crafting elegant sentences only to trash them when they realise they don't fit in with the bigger picture.

If you try this course please let Geoff (geoff@ncbs.res.in) know how you go.

Monday, November 9, 2009

The Inverted Pyramid style of writing

Want to grab attention like a front page journalist? The Inverted Pyramid style of writing is one of the keys. What is it, and how can bCisive and Rationale help you to learn to how to do it, and keep on doing it?

The inverted pyramid

What is it?
The Inverted Pyramid style of writing is commonly seen in print journalism, where it allows the reader to leave off reading at any point, and still have the gist of the story. It is also an excellent style when writing for busy people, because it gives a summary at the start, then delves into increasingly more detail, rather than "building up suspense".

How to do it
Here's an example of a list of facts to be assembled into a news article (source article):
An accident occurred. It happened yesterday. Today is Tuesday. The accident was a car accident. It happened in Murfreesboro where Main Street and Broad Street intersect. One person was killed. The person was John Frazier. He was 20 years old and lived in Murfreesboro at 212 Moore Court. He was driving a blue 1998 Ford Mustang. He was driving northwest on Broad Street at about 5 p.m. He lost control of the car. It was raining, and the road was slick. He was also driving about 20 mph over the speed limit. He was the only one in the car. The car smashed into a utility pole along Broad Street. The impact crushed the whole front of the car. Frazier was thrown through the car's windshield. He landed on the pavement some 20 feet away. He wasn't wearing a seat belt. He was killed instantly.
Let's organize these visually, under the headings What?, When?, Who?, Why? and How?:

The facts arranged visually (click for full size)

In this case I have not only classified the facts by placing them under the relevant questions, but also arranged them in order of importance. The most import facts respond directly to the questions, with elaborations below.

To draft the start of an Inverted Pyramid style story, I simply hide the lower reaches of my map:

The top of the map gives a visual summary

A suggested first sentence draws on all these elements, quickly summarizing the situation:
A Murfreesboro [Where] man [Who] died [What] Monday afternoon [When] when his car spun out of control [How] on rain-slickened [Why] Broad Street [more Where], crashed into a utility pole and threw him through the windshield [more How].
The rest of the story can be constructed by delving into more detail mainly around one of the top level questions at a time.

A visual approach
By using Rationale or bCisive (in this case I used bCisive Online) you can quickly and visually organize your facts so that they are not just listed, but well structured. From there the structure of your writing will follow easily, and it just remains to polish the prose so that it sounds good too.

Being able to easily drag and drop the pieces and have the layout automatically adjust makes the use of such tools much quicker and easier than using pen and paper or whiteboard, or text-editing or straight drawing software.

Finally, export a text form of your map to create the basis for the final, well-structured, written version.
Related Posts with Thumbnails